

A better way to perform your statistics
Log-Rank test to compare survivals
You can easily compare survival in different groups of patients thanks to our automated analysis tool. The Log-Rank test is automatically performed when you compare groups. The p-value and the survivals of each group are calculated and provided for inclusion in your article.
Vivid and professional charts
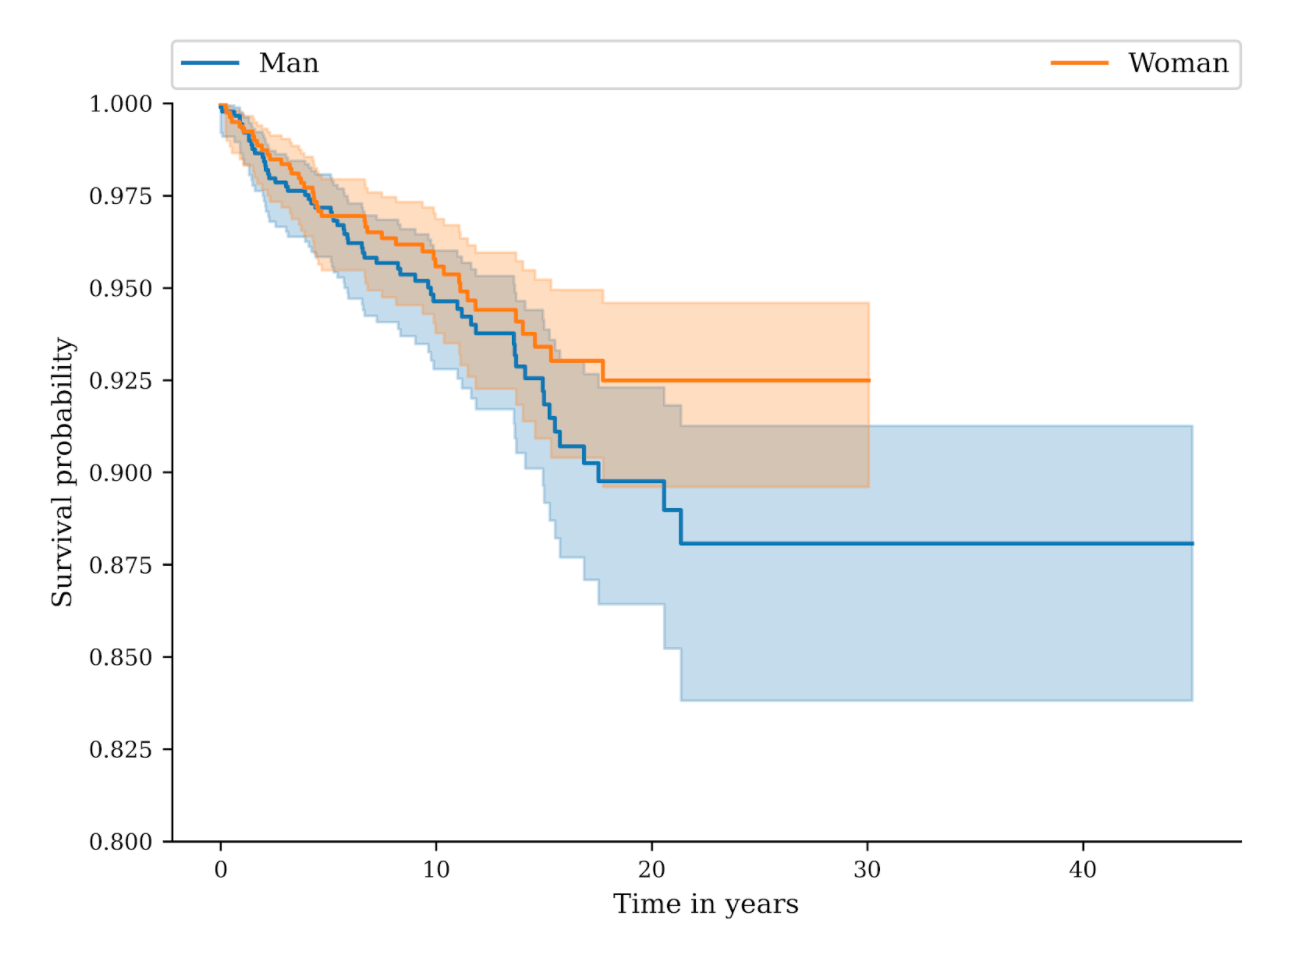
Survival curves are automatically generated from your data. Charts can be downloaded in high definition (600 dpi) and added directly to your publication or presentation. Several templates are available to best fit your needs.
Automatically generated texts for your article
95% confidence intervals are calculated at each delay to provide you with the survival of your patients in each group. These confidence intervals are also plotted on the survival curves.
What is the Log-Rank test?
The Log-Rank test (sometimes called the Mantel-Cox test) is a statistical test used to compare the survival distributions of two groups of patients. It is the most frequently used test to compare survival in clinical trials.
Can I use the Log-Rank test with only one group?
No, the Log-Rank test is used to compare survivals of two groups. To calculate the survival of one group of patients, the Kaplan-Meier method is usually used in medical research.
Can I use the Log-Rank test with more than 2 groups?
Yes, EasyMedStat offers a generalized version of the Log-Rank test that lets you compare up to seven groups of patients.
How do I prepare my data for analysis?
It is very easy! All you need to do is to provide the date of inclusion in the study for each patient and, if the event occurred, the date where the event happened. You do not need to calculate the delay or anything else. To compare groups, you also need to have a variable (column) that indicates which group each patient is in. You do not need to “code” this column with numbers. You could for example write “Man” and “Woman”, or “Yes” and “No” to separate your groups of patients. You can import an Excel file, a CSV file or simply add your patients one after the other if you do not have an Excel file.