
September 6, 2021
Monitor your studies and patient inclusions more precisely with the reports
This article has been written by
Your data is directly available from your eCRF for other purposes and you don’t have any data cleaning to do! Have an overview of your study directly from the automated and custom dashboards.
Automated inclusion reports
Get an overview with the main indicators of the studies with an automated report including:
You also get a graph that shows the number of inclusions made throughout the study and last but not least, a table that shows the number of inclusions in each center and for each week.
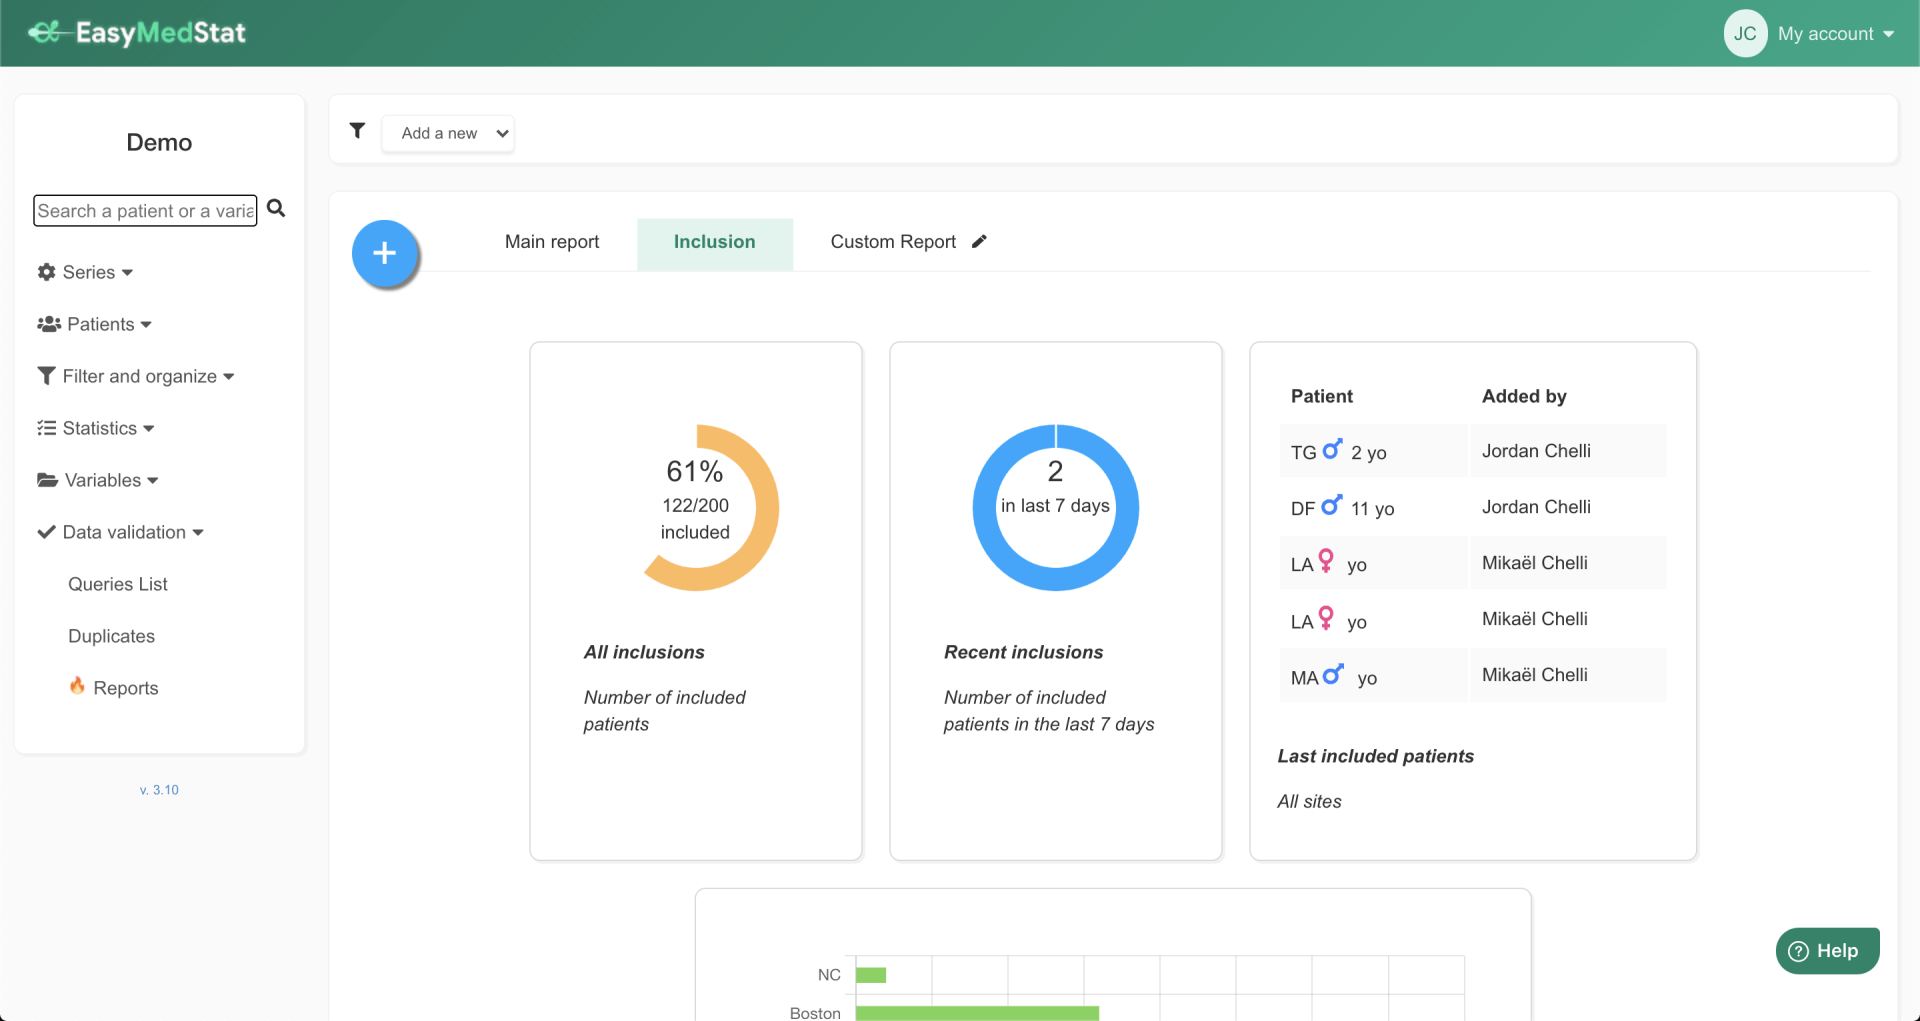
This automated report gives even more detail on the inclusions such as:
- The overall inclusion progress
- The weekly inclusion rate
- The time remaining to conduct your study
You also get a graph that shows the number of inclusions made throughout the study and last but not least, a table that shows the number of inclusions in each center and for each week.
This automated report gives even more detail on the inclusions such as:
- The number of patients included over the last 7 days
- The last five patients included
- Total patients included for each site
Create your personalized reports
Create and name your custom reports and design your own components within a mouse click.
You can analyze the number of inclusions by a given variable. For example, if you are studying the effect of a treatment and its placebo on a group, you can add the graph to your report. It will appear directly on your personalized reporting dashboard.
You can also add other components such as the number of inclusions per hospital, or the number of inclusions according to a specific variable. For example, if you want to display the diabetes status (or not) of your patients or the number of inclusions according to the hypertension status (or not) of your patients. You can as well create a table with the number of inclusions per hospital over time or other types of components, according to your needs and what you want to show.
Customize and create as many components as you want based on the variables you want to analyze. It is also possible to change the display by easily moving the components on the page.
You can analyze the number of inclusions by a given variable. For example, if you are studying the effect of a treatment and its placebo on a group, you can add the graph to your report. It will appear directly on your personalized reporting dashboard.
You can also add other components such as the number of inclusions per hospital, or the number of inclusions according to a specific variable. For example, if you want to display the diabetes status (or not) of your patients or the number of inclusions according to the hypertension status (or not) of your patients. You can as well create a table with the number of inclusions per hospital over time or other types of components, according to your needs and what you want to show.
Customize and create as many components as you want based on the variables you want to analyze. It is also possible to change the display by easily moving the components on the page.
All the features you need
This new feature has been developed so that you can optimally and precisely monitor and control your inclusions throughout your study. There are other components available such as:
Start your clinical studies now and manage them easily thanks to the reports!
- The percentage of inclusions
- Inclusions over time
- The inclusion rate
Start your clinical studies now and manage them easily thanks to the reports!
July 6, 2026
Dans toute étude clinique, la qualité des données dépend en grande partie de la qualité de la saisie. Une erreur de valeur, une incohérence entre plusieurs variables ou une information inhabituelle peuvent avoir un impact important sur les analyses et nécessiter un travail de monitoring supplémentaire. Jusqu'à présent, EasyMedStat proposait déjà un système de bornes permettant de signaler certaines erreurs évidentes. Par exemple, empêcher la saisie d'une taille de patient supérieure à une valeur autorisée. Avec les Real Time Alerts, nous allons beaucoup plus loin.
July 6, 2026
Dans toute étude clinique, la qualité des données dépend en grande partie de la qualité de la saisie. Une erreur de valeur, une incohérence entre plusieurs variables ou une information inhabituelle peuvent avoir un impact important sur les analyses et nécessiter un travail de monitoring supplémentaire. Jusqu'à présent, EasyMedStat proposait déjà un système de bornes permettant de signaler certaines erreurs évidentes. Par exemple, empêcher la saisie d'une taille de patient supérieure à une valeur autorisée. Avec les Real Time Alerts, nous allons beaucoup plus loin.
Share this article