Découvrez ce qu'est l'eCRF, ce qui le différencie d'un EDC, ses avantages, ses réglementations (RGPD, ISO 14155, FDA 21 CFR Part 11) et comment bien le choisir.
Discover what an eCRF is, how it differs from an EDC, its key features, regulatory requirements (GCP, FDA 21 CFR Part 11, GDPR), and how to choose one.
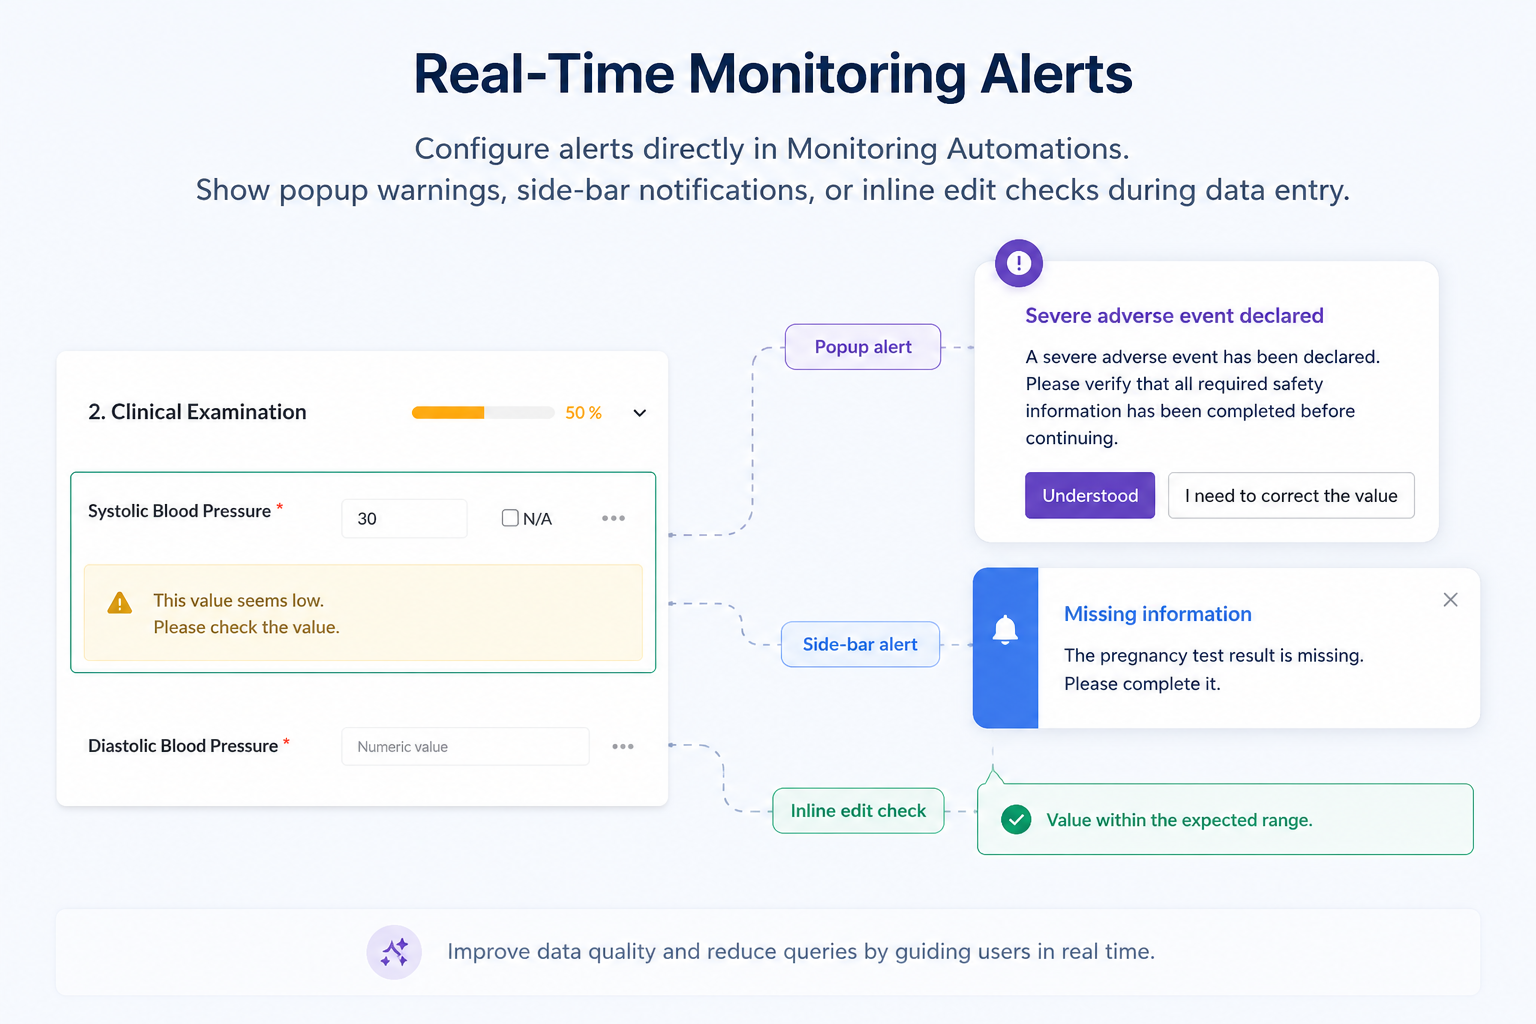
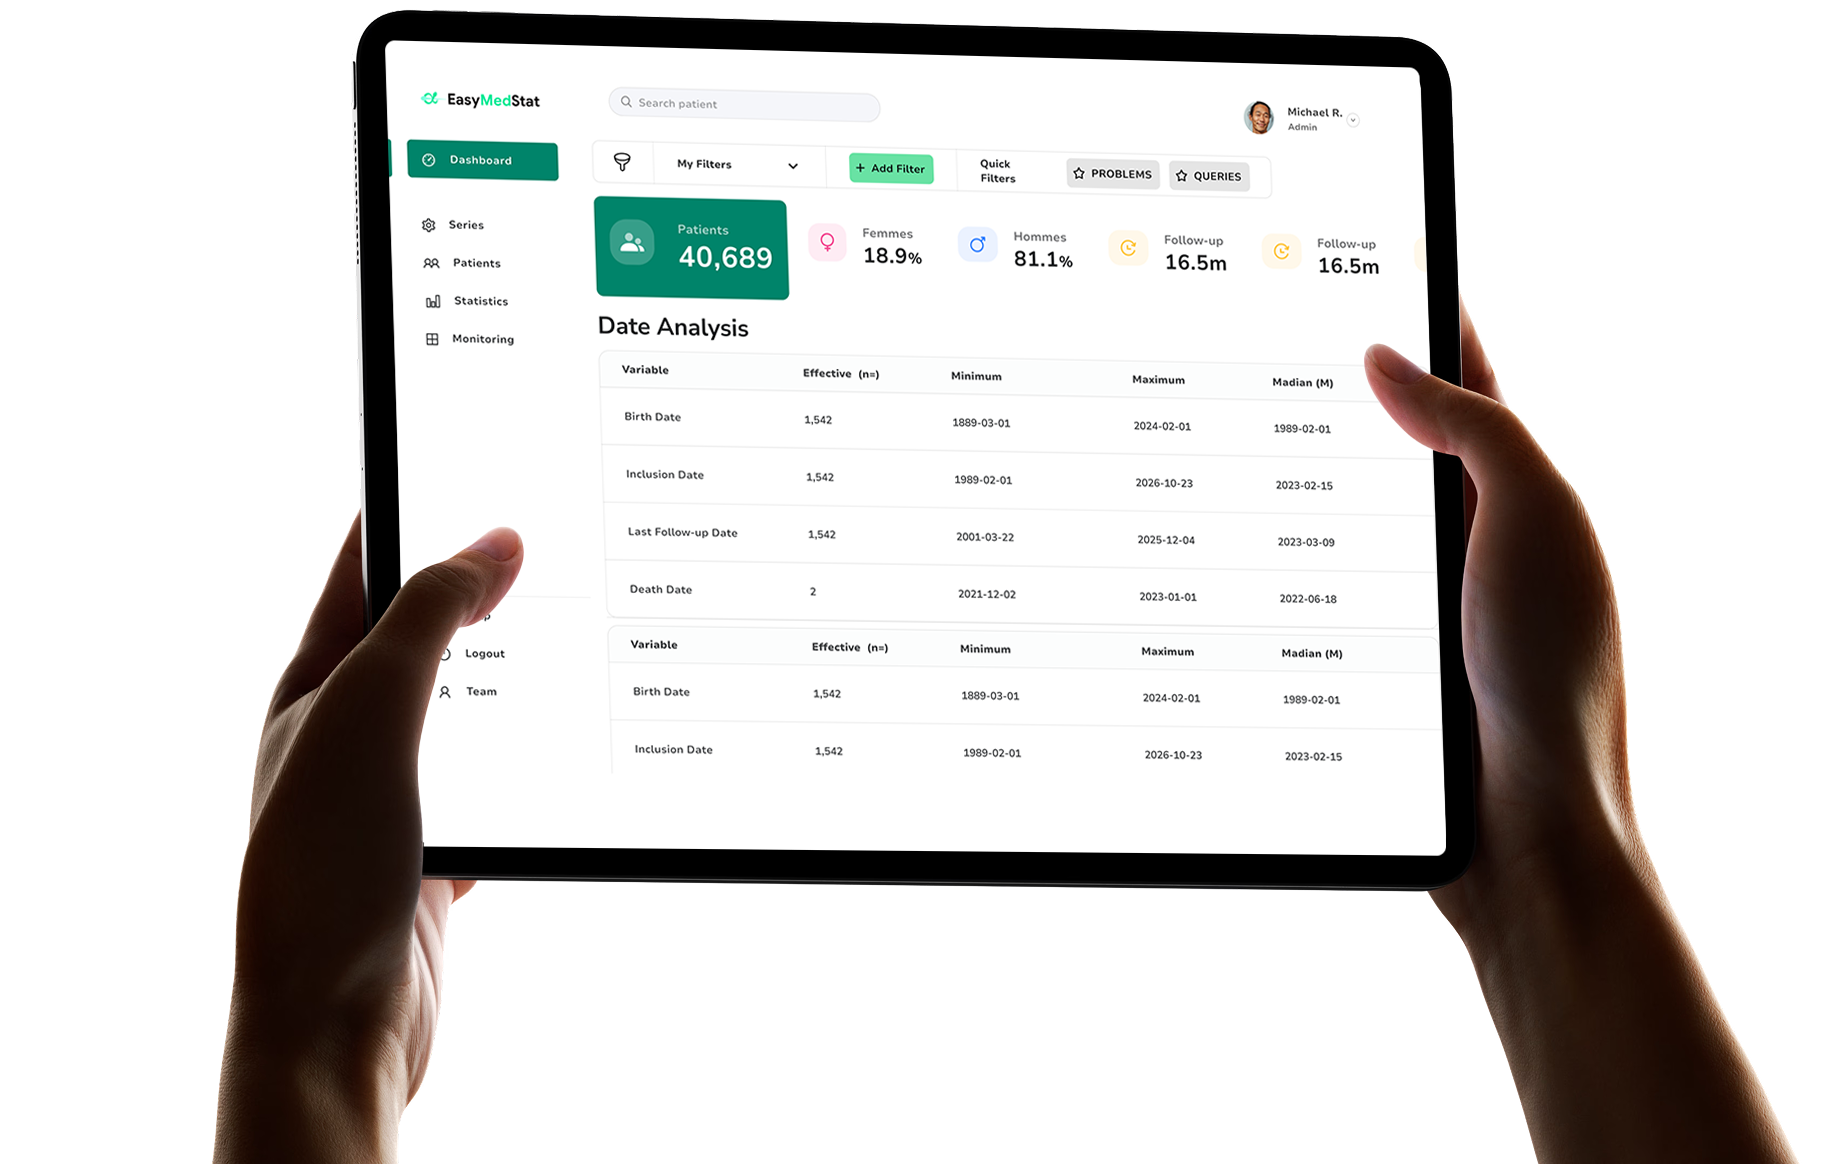
Discover EasyMedStat's Real Time Alerts: smart, customizable checks that catch data errors instantly and improve clinical trial data quality.
Découvrez ce qu'est l'eCRF, ce qui le différencie d'un EDC, ses avantages, ses réglementations (RGPD, ISO 14155, FDA 21 CFR Part 11) et comment bien le choisir.
Discover what an eCRF is, how it differs from an EDC, its key features, regulatory requirements (GCP, FDA 21 CFR Part 11, GDPR), and how to choose one.
Discover EasyMedStat's Real Time Alerts: smart, customizable checks that catch data errors instantly and improve clinical trial data quality.